The complete toolbox for Enterprise Production Reporting
Trends
Set the target and assess improvement intiatives through trends in OEE, Availability, Performance, Quality or Efficiency.
Includes YTD comparisons and Time & Frequency Loss charts for specific losses.
Compare Shifts ~ Lines ~ Parts. Compare same part - mutliple lines. Fast! Easy!

View OEE and A, P, Q components trends as they relate to one another. Use the Hierarchy and Production Filters to view the data you want.
Set a target, view Trend progression and Average trend.
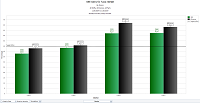
Compare OEE, Availability, Performance, Quality, Efficiency and more components from last year to this year-to-date.
View by Month, Quarter or Year.
View by Lines or Shifts.
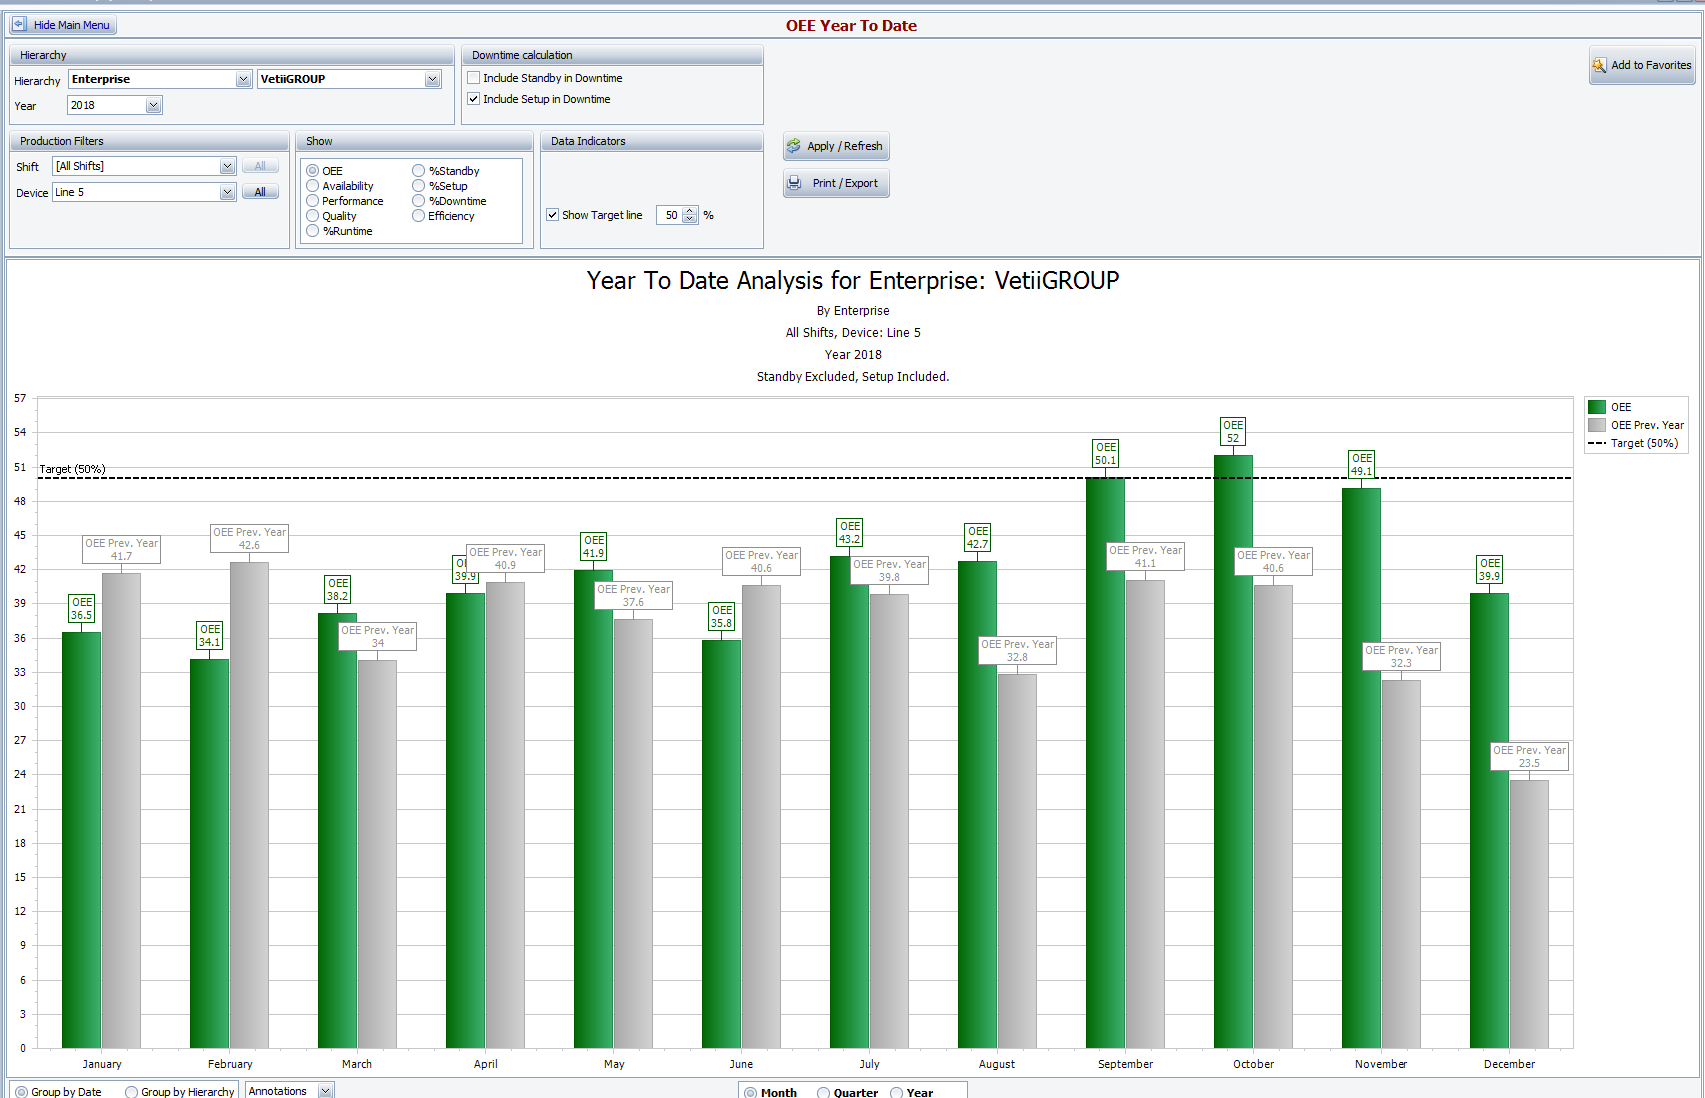
Select a specific loss type to view Time & Frequency trends by date grouping. View Trend progression along with Average progression.
You can also display the Average Duration of the loss event to get a sense of the nature of occurrences.
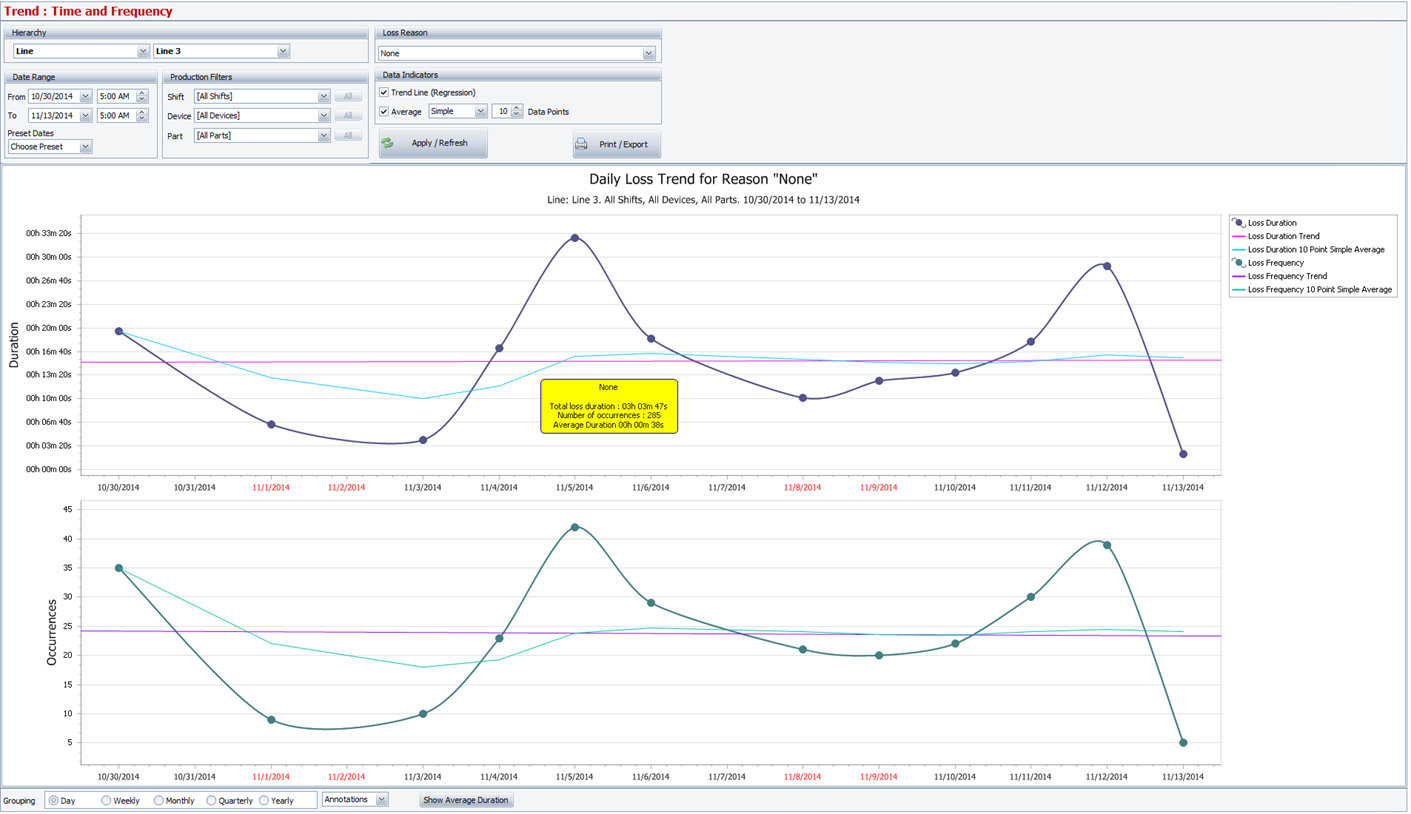
Loss Reason Frequency and Duration - In addition to finding the average duration during the selected date range, you can now see the average duration at each data point.
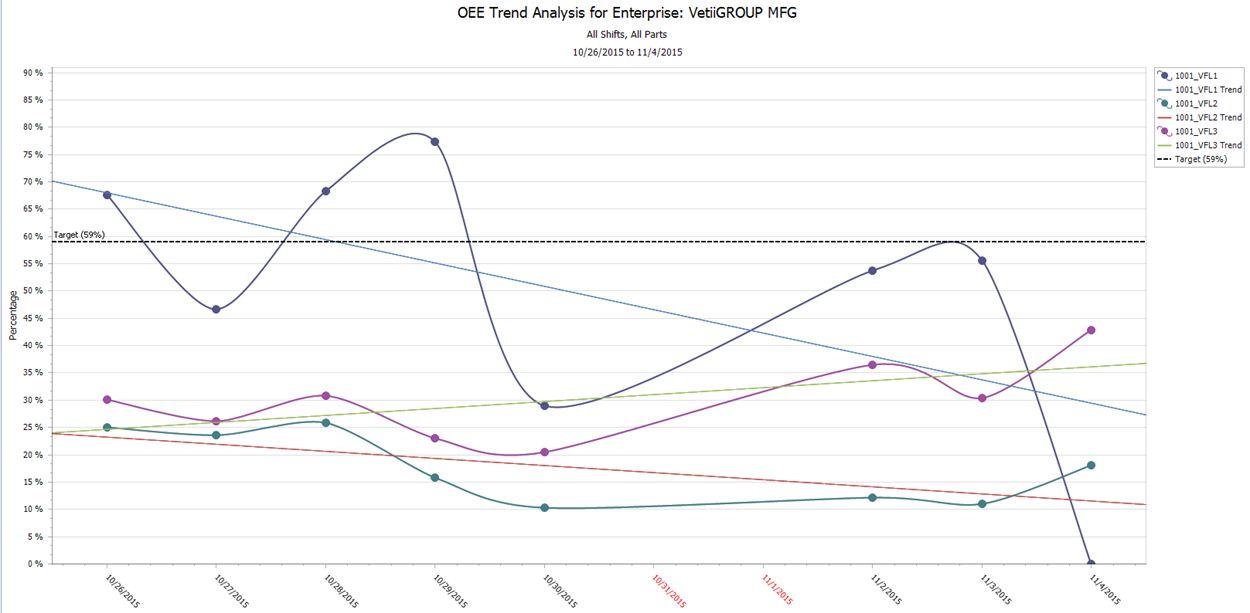
OEE Trends - Compare lines, shifts and parts. Highly selectable report options with consistent navigation.
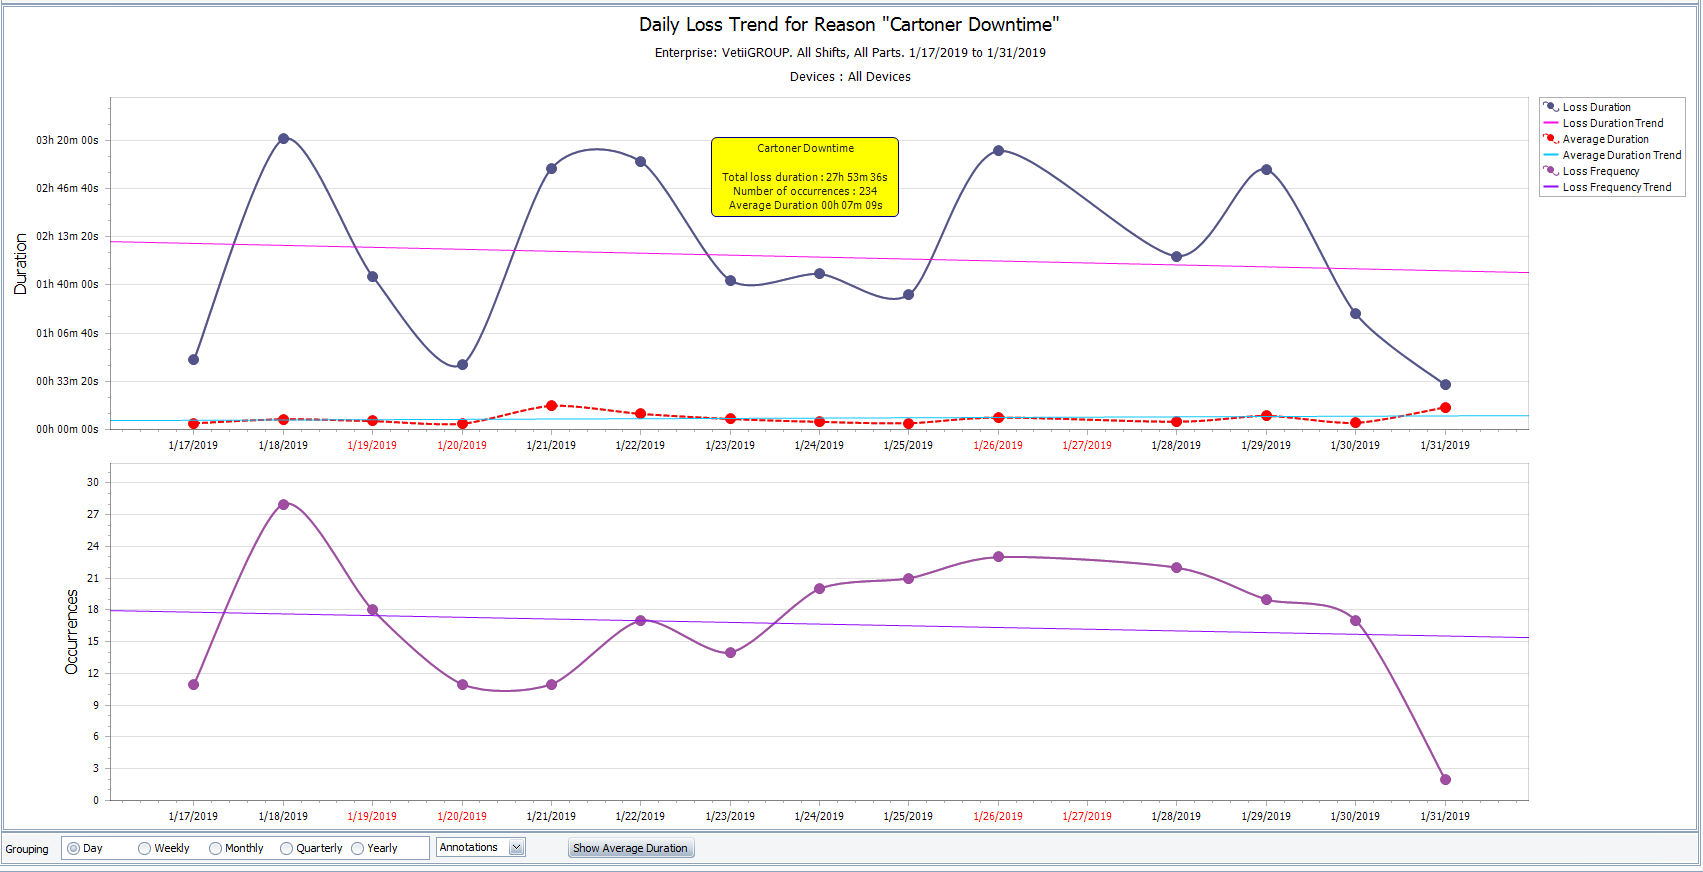
Loss Reason Trends - Highly selectable report options with consistent navigation. Select one or more lines. (v4.4)