The complete toolbox for Enterprise Production Reporting
Analysis
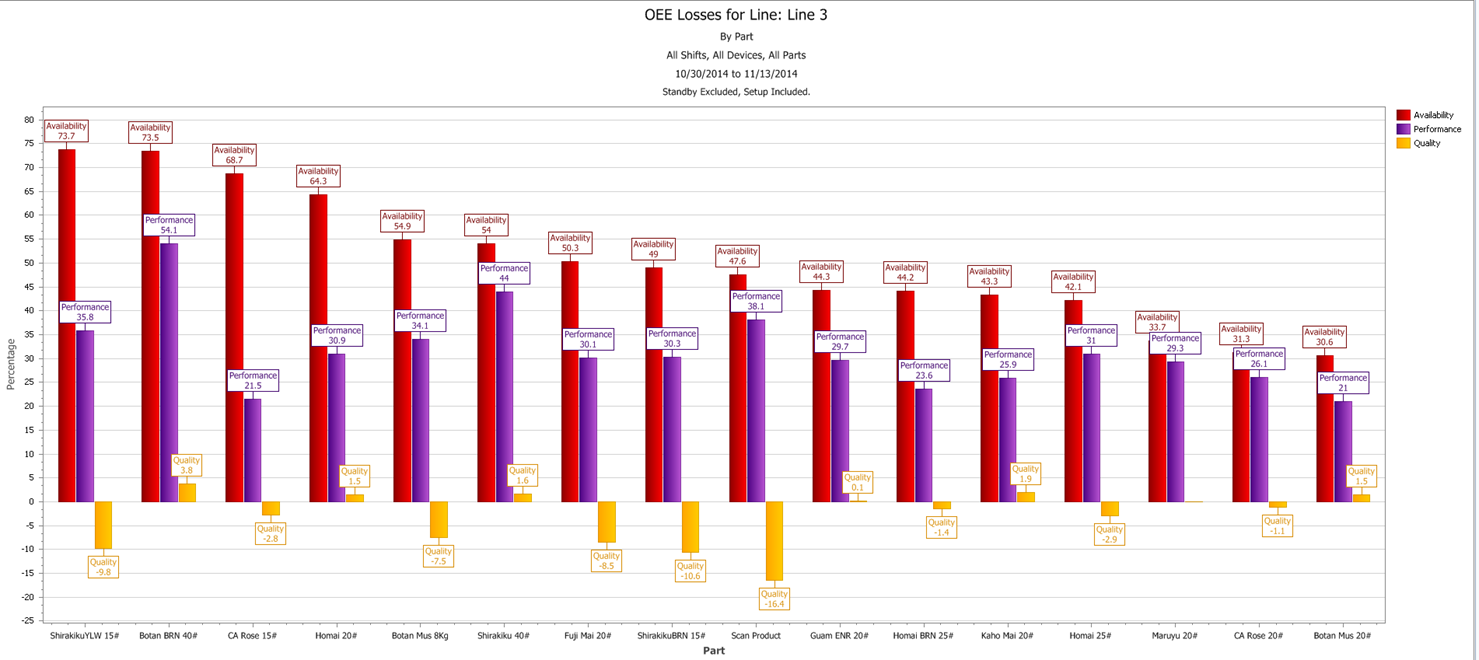
Compare KPIs for different plants, lines, shifts or even products with one another.
OEE (Overall Equipment Effectiveness)
OOE (Overall Operations Effectiveness)
TEEP (Total Effective Equipment Performance).
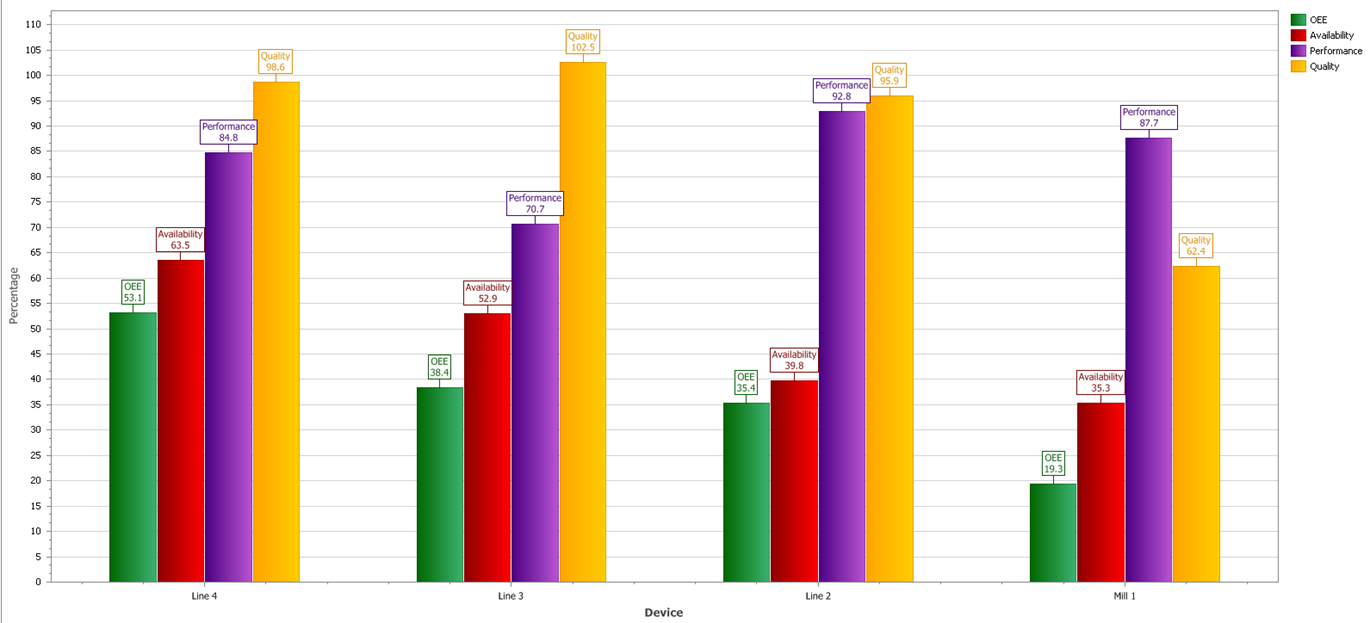
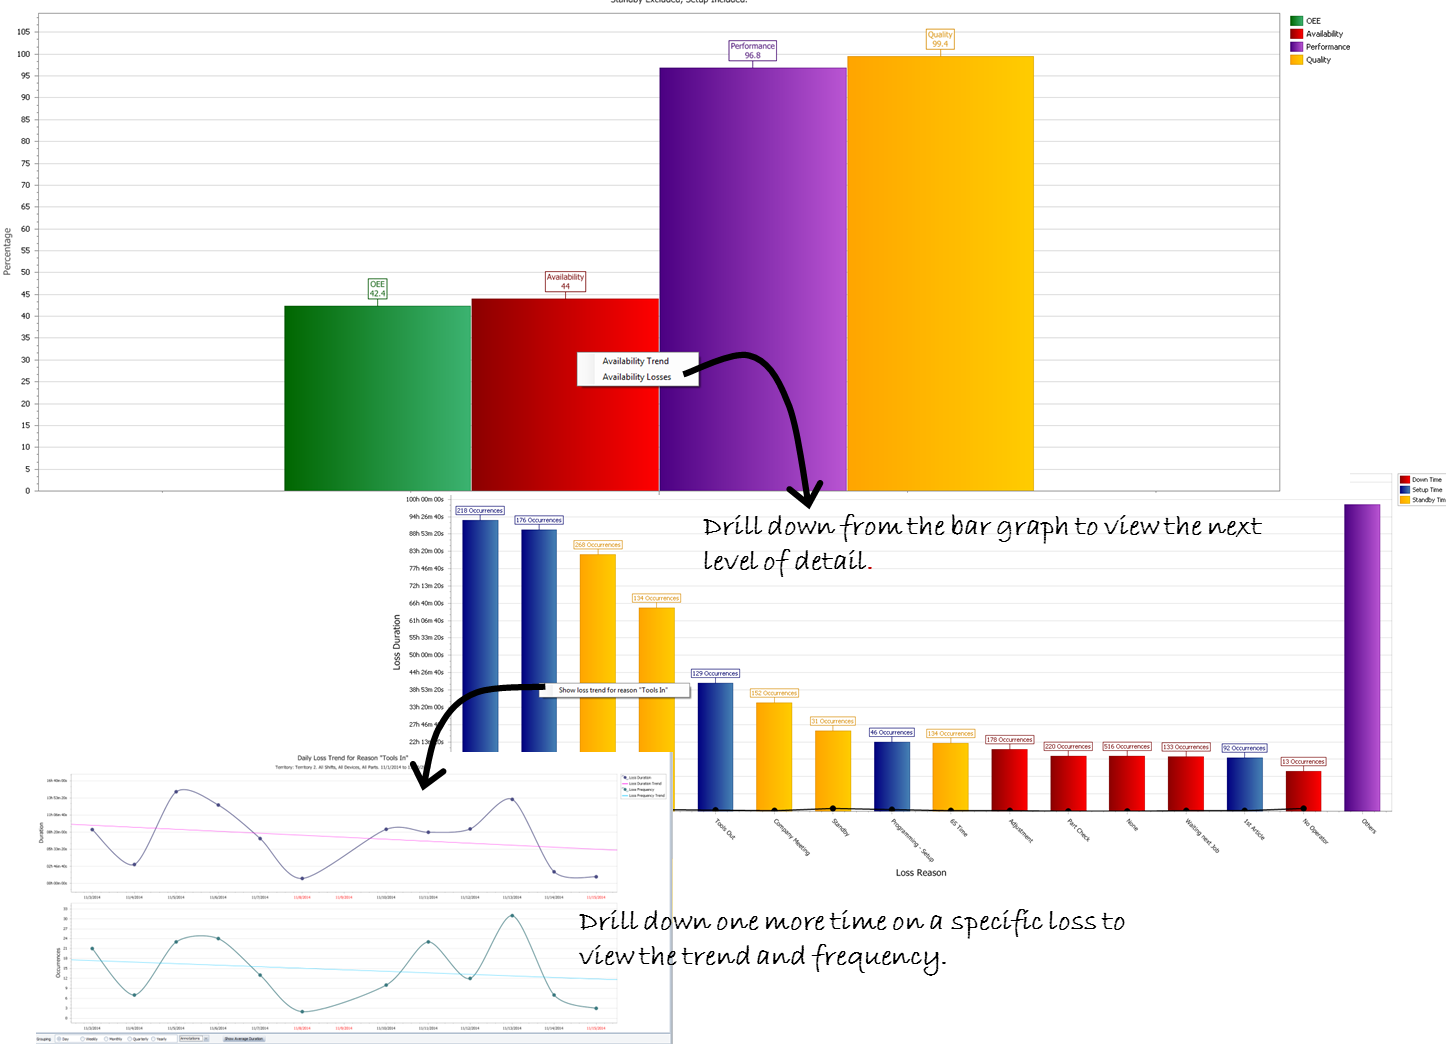
Drill-down in action! Right-click on any of the bars in the chart to view more detail associated with that component. For example, view all the Availablity Losses. Then right-click one more time to view frequency and trend of a specific loss.
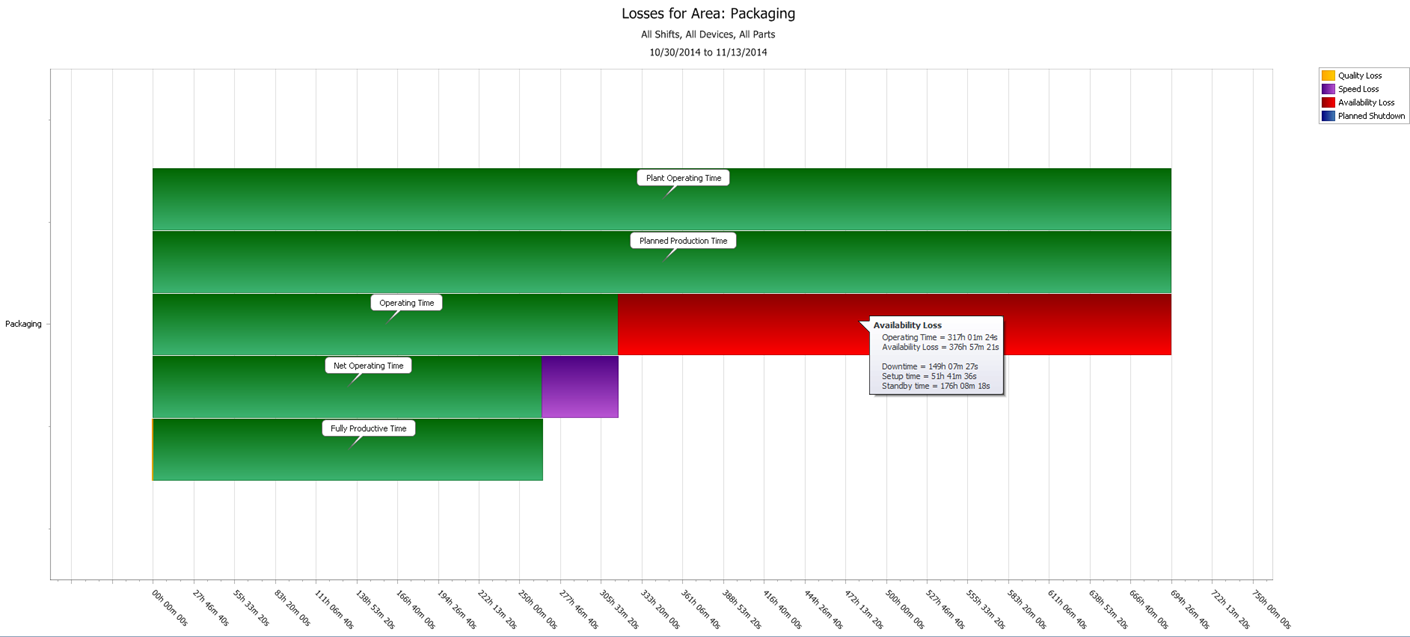
Asset utilization - View the total performance of equipment based on the amount of time the equipment was available.
TEEP By Hierarchy View equipment performance by line or types of lines, depending upon your hierarchy.