The complete toolbox for Enterprise Production Reporting
Navigating through OEE Studio
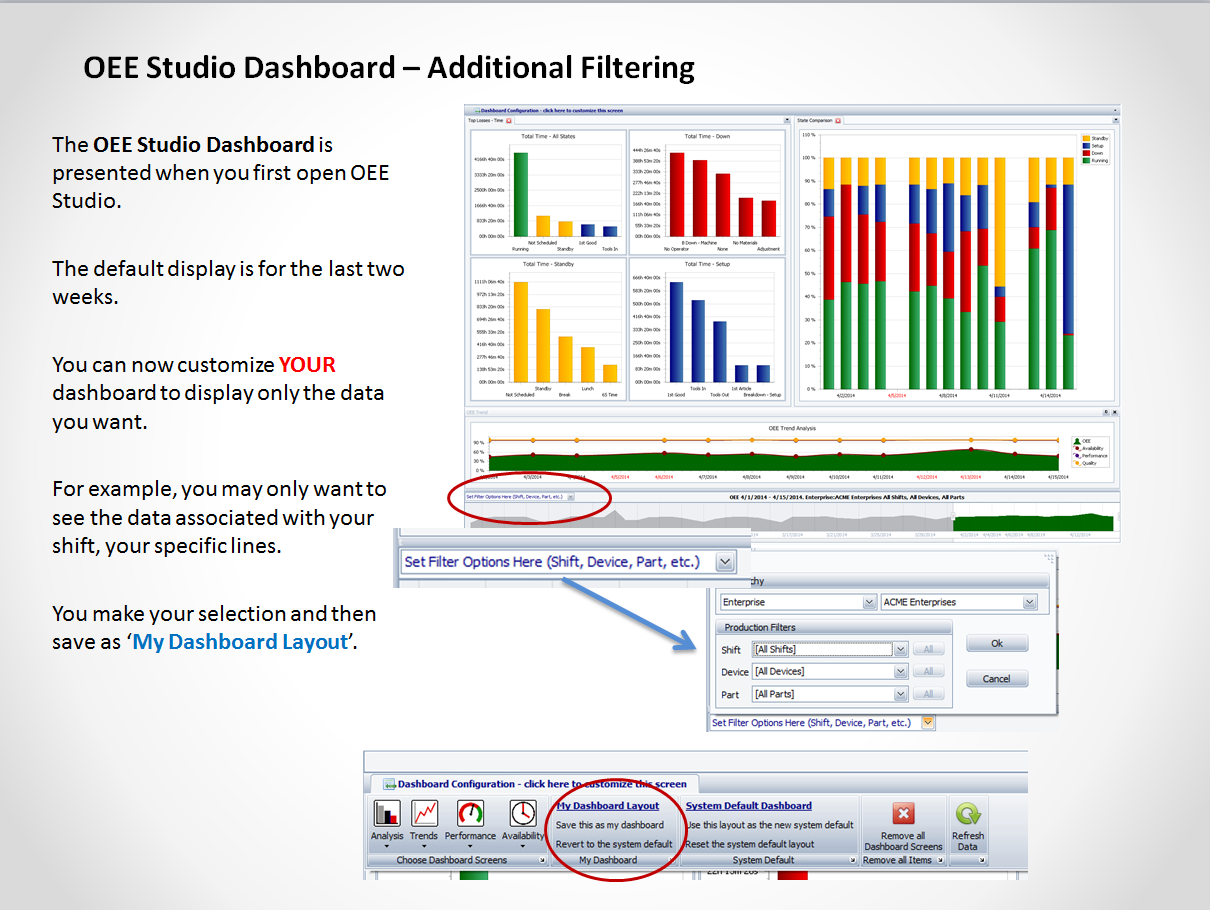
Customize your Dashboard ~ Save reports as Favorites
Create Report Templates for you and others
Getting to good data in 3 clicks
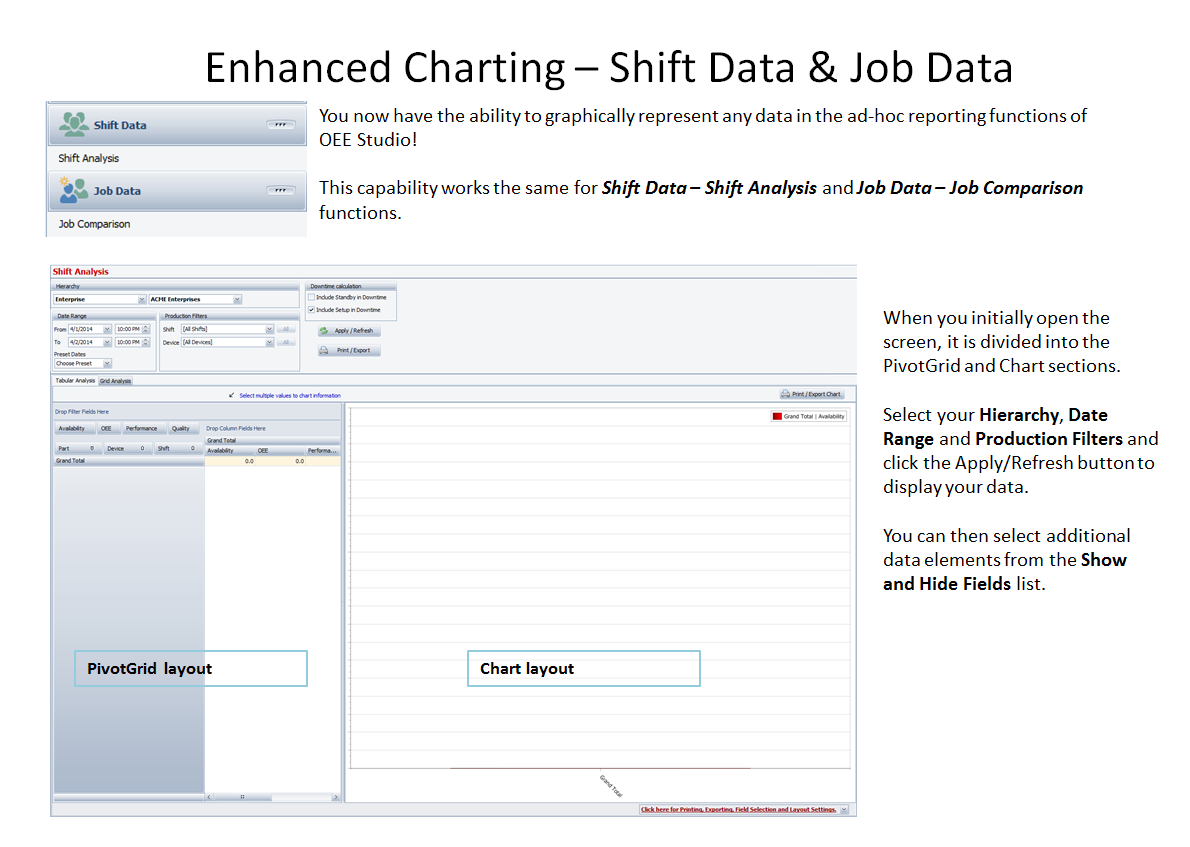
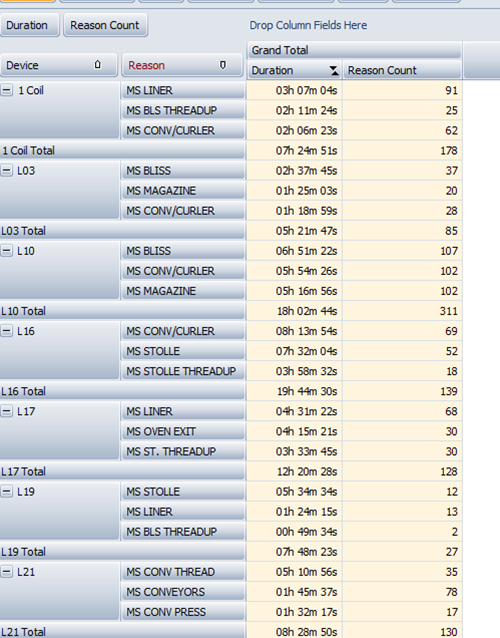
Create your report in the Pivot Grid and then graphically represent that data in the Chart Layout.
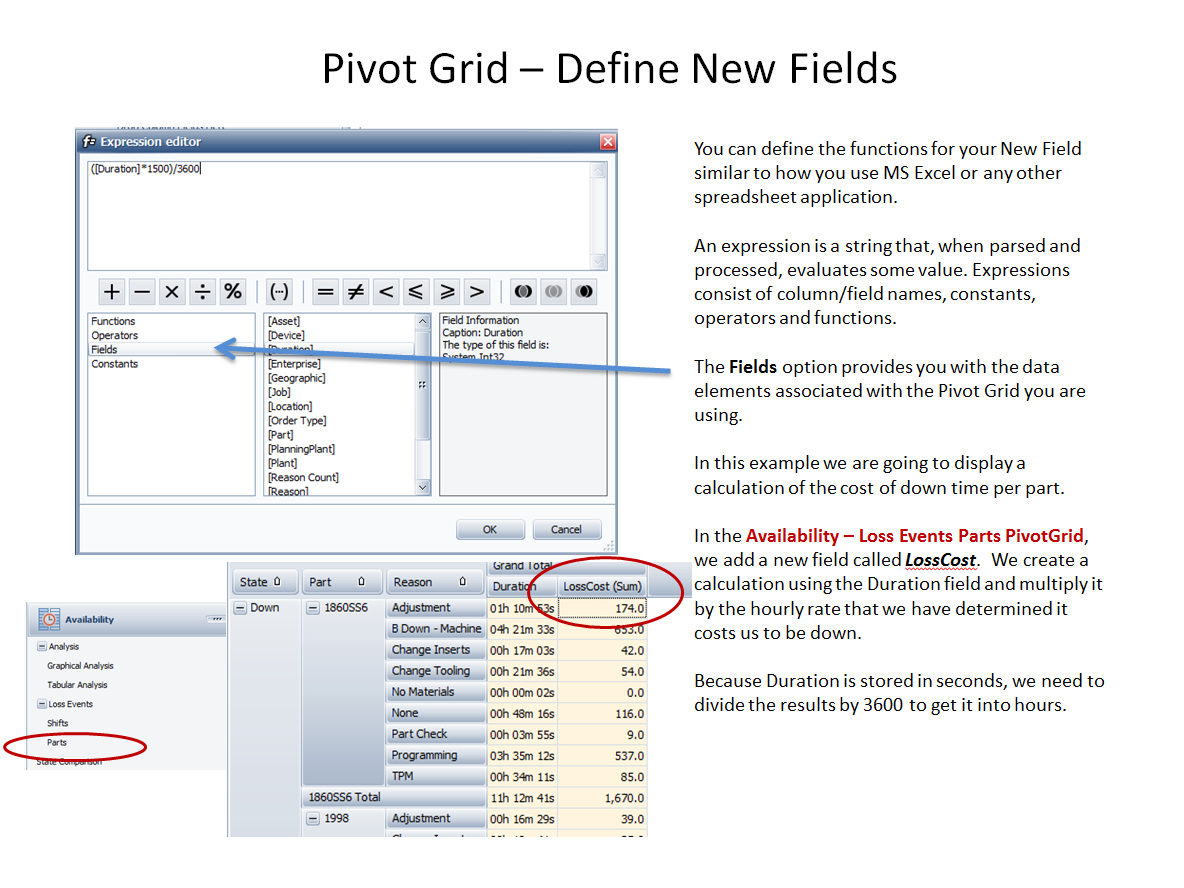
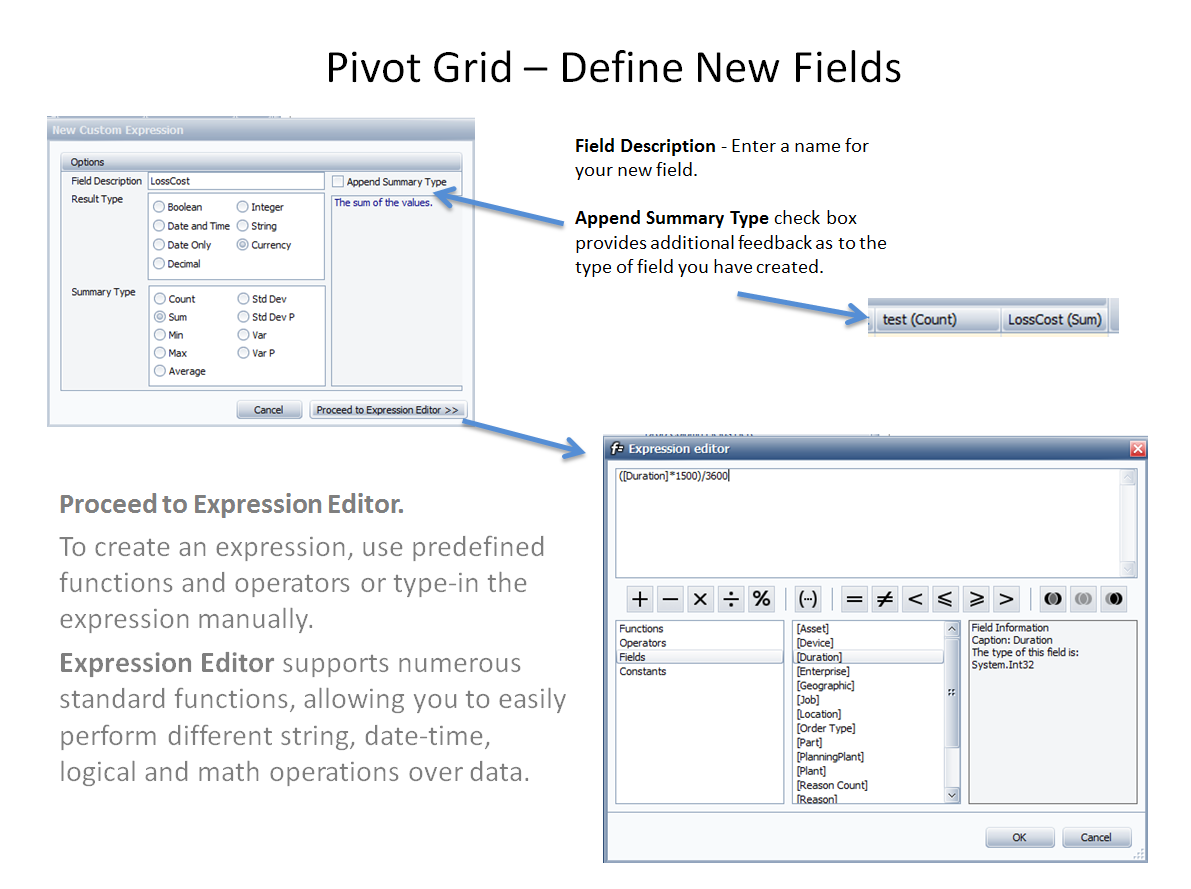
Define New Field Step 2 - Proceed to the Expression Editor to build the calculations or expressions.
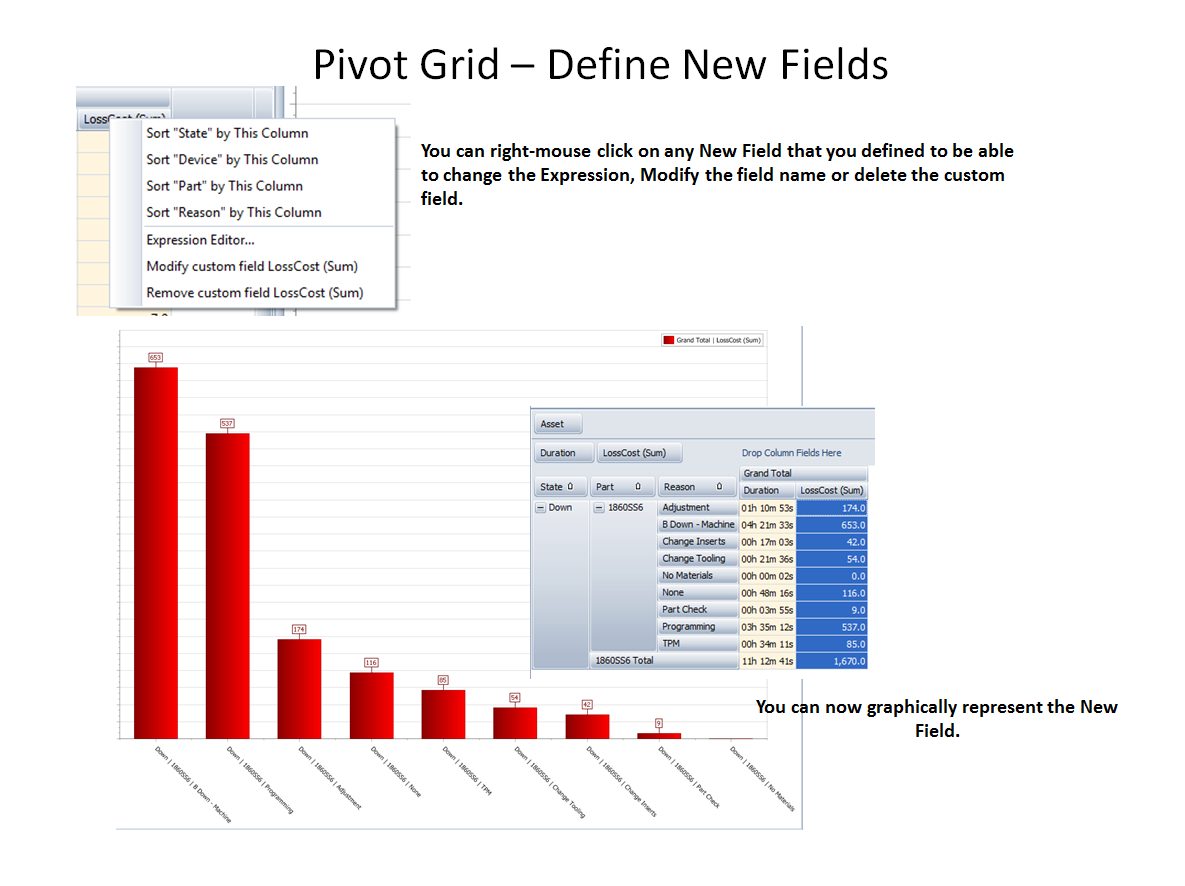
Define New Field Step 3 - View the data - Either through the Pivot Grid or Graphically displayed.

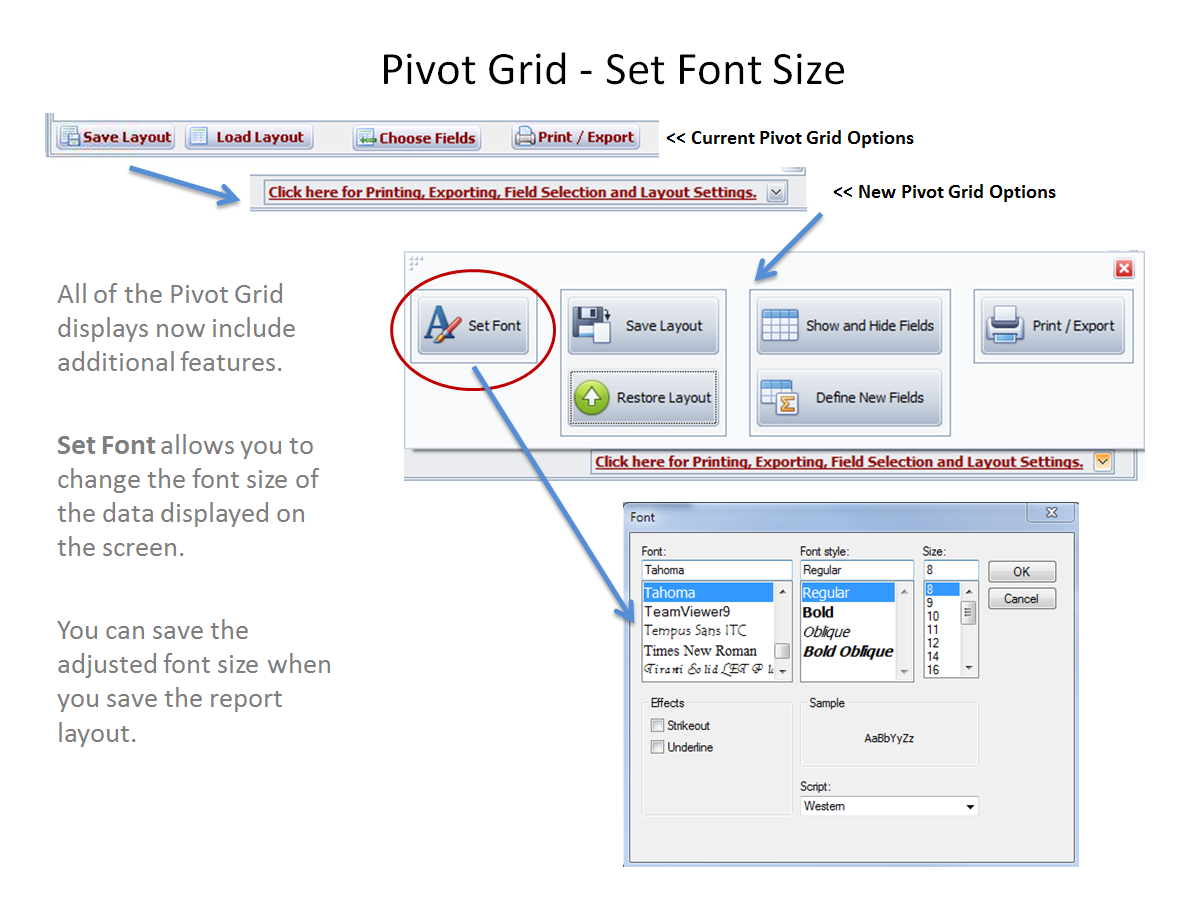
Save Layout allows you to save the layout of an ad hoc report you created.
Restore Layout allows you to restore or load a saved layout. You can save layouts for yourself or for All Users.

Show and Hide Fields allows you to pick and choose which data elements you want displayed in the Pivot Grid. There are different data elements based on the selected Pivot Grid.
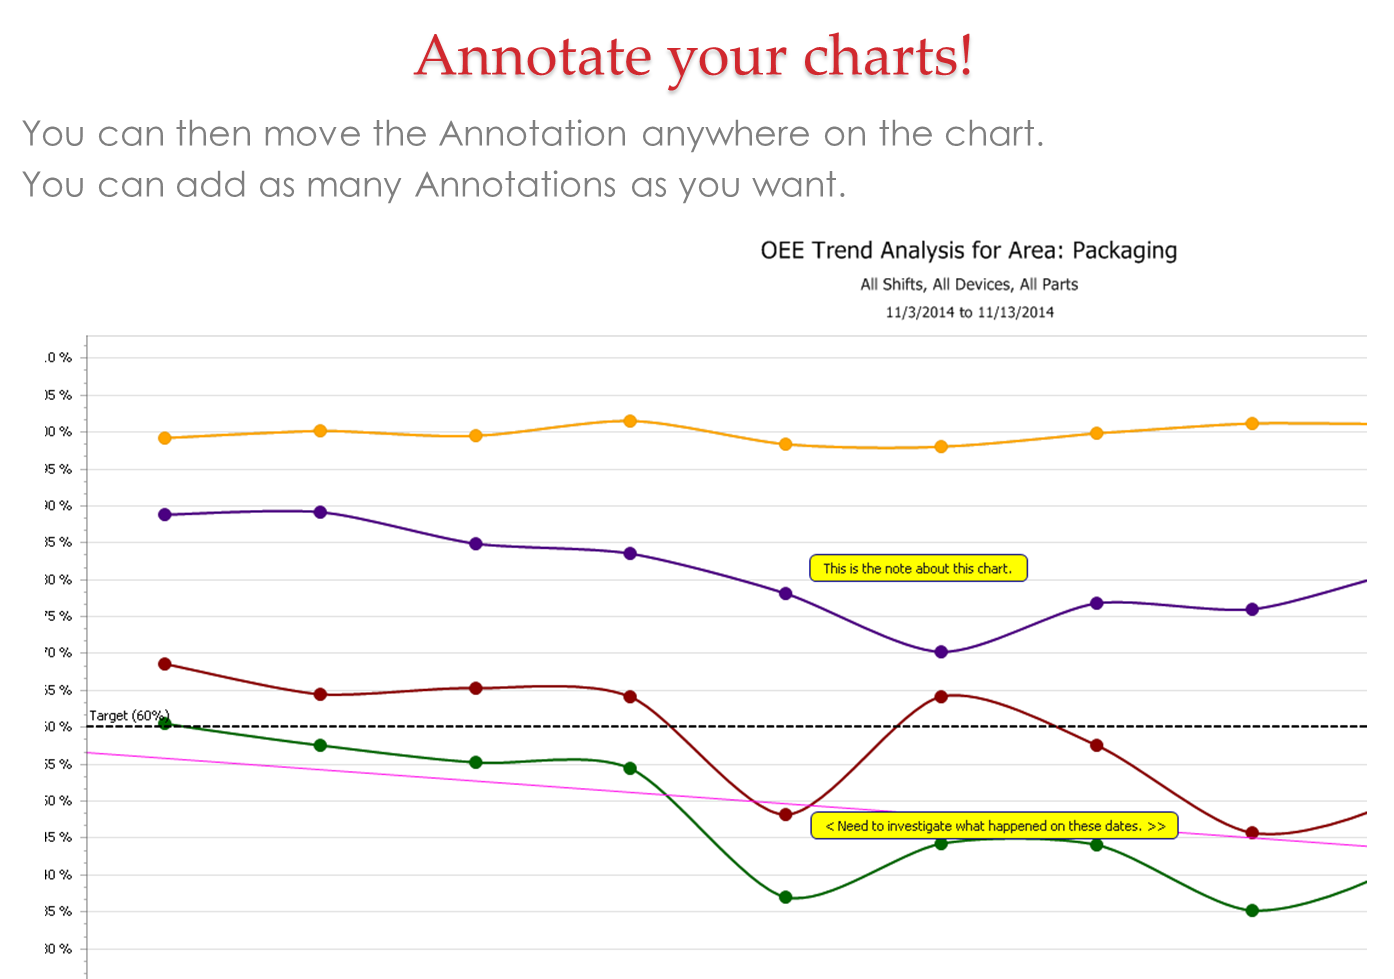
Charting Otions Annotate any of the charts and graphs. New for v5.5 Enhanced charting options - build your own charts in any of the Pivot Grids

Pivot Grid Drill-Down All of the Pivot Grids provide the ability to drill-down to the detailed data.
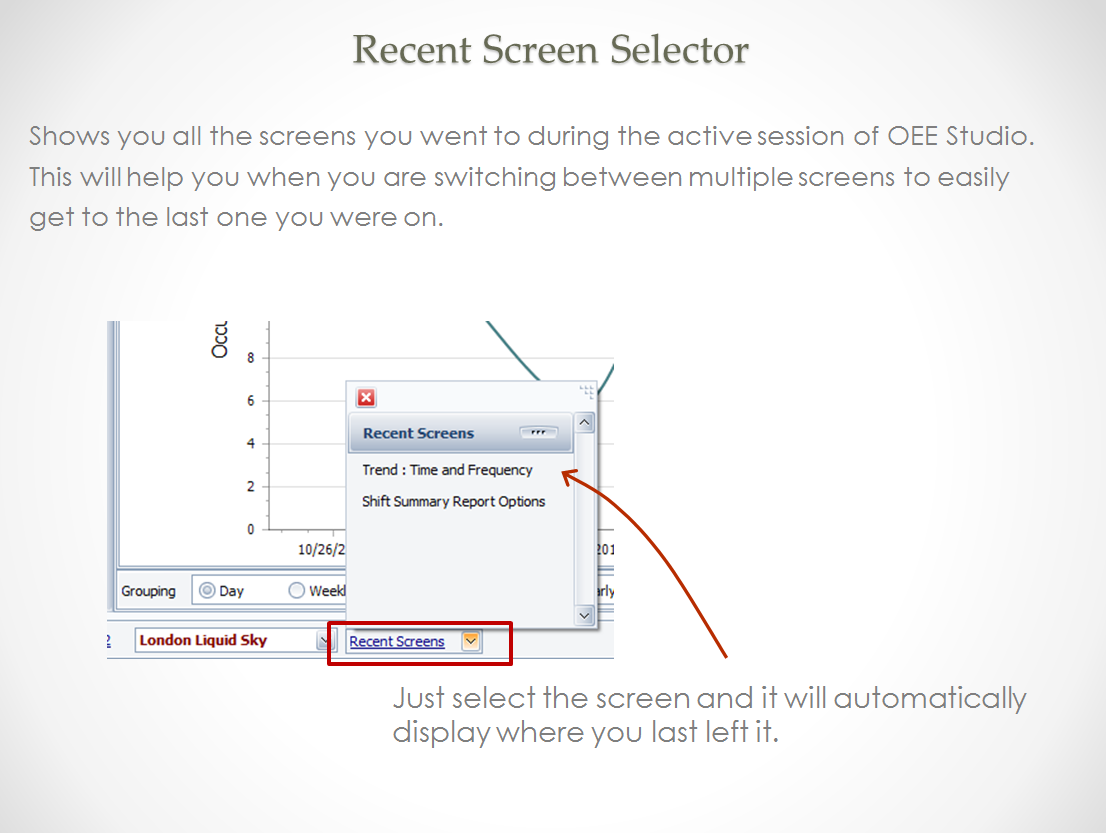
Recent Screens Shows all the screens you went to during the active session of OEE Studio.
Helps when switching between multiple screens to easily get to the last one you were on.

Show - Hide Main Menu To view reports in full screen mode - click on the Hide Main Menu button.
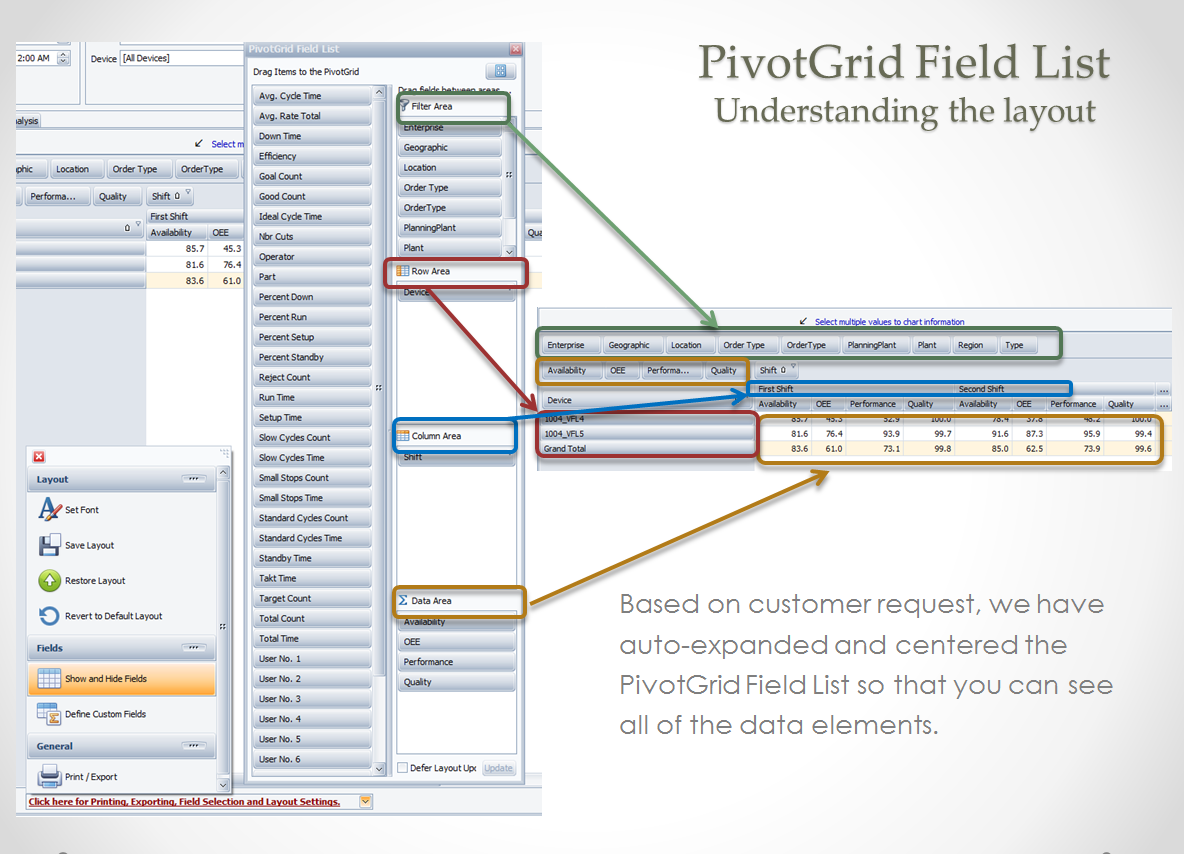
Understanding the Pivot Grid Layout Know where to place the data elements for maximum analysis.
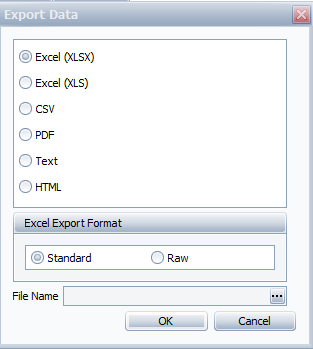
Export Data Optionally select to Export Data to a multitude of options and to export to MS Excel either Raw data or Standard OEE Studio format.
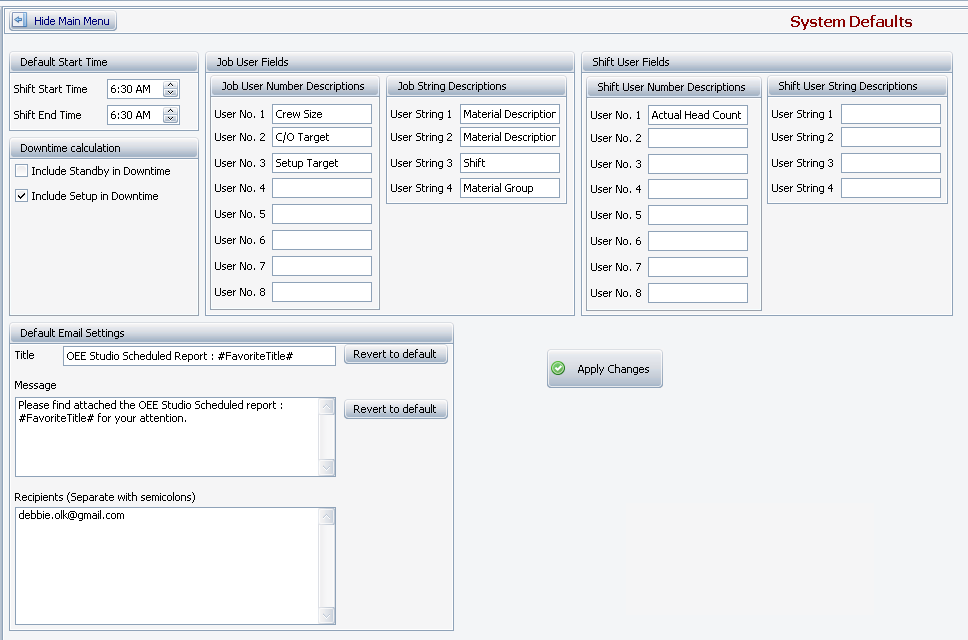
Default Settings Now you can save the Default Settings by each user. This is especially helpful for mutliple locations with different time zones and shift start and end times. (v4.4)

