
The complete toolbox for Enterprise Production Reporting
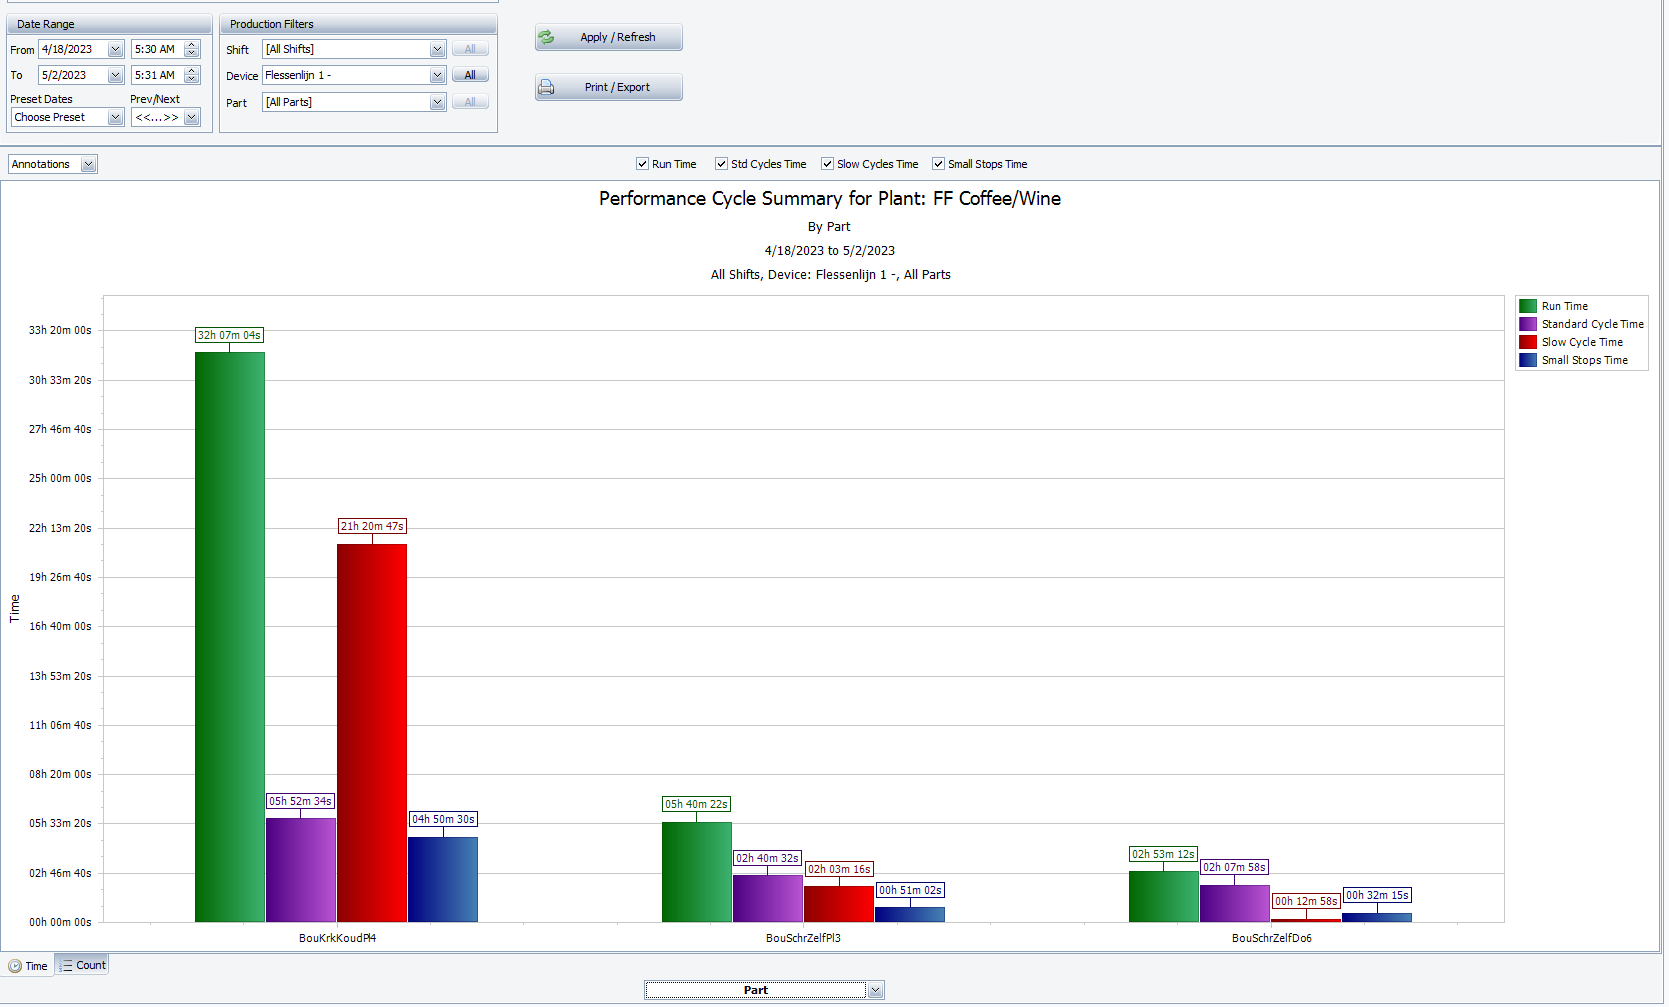
Performance
Graphically view Performance by time or by number of occurrences.
Compare Run Time to Standard Cycles, Slow Cycles and Small Stops.
Helps to verify ideal cycle time thresholds per line.
Perfomance is the Actual Count (good + reject) during Run Time, verses the expected count for that Run Time, based on Ideal Cycle Time.
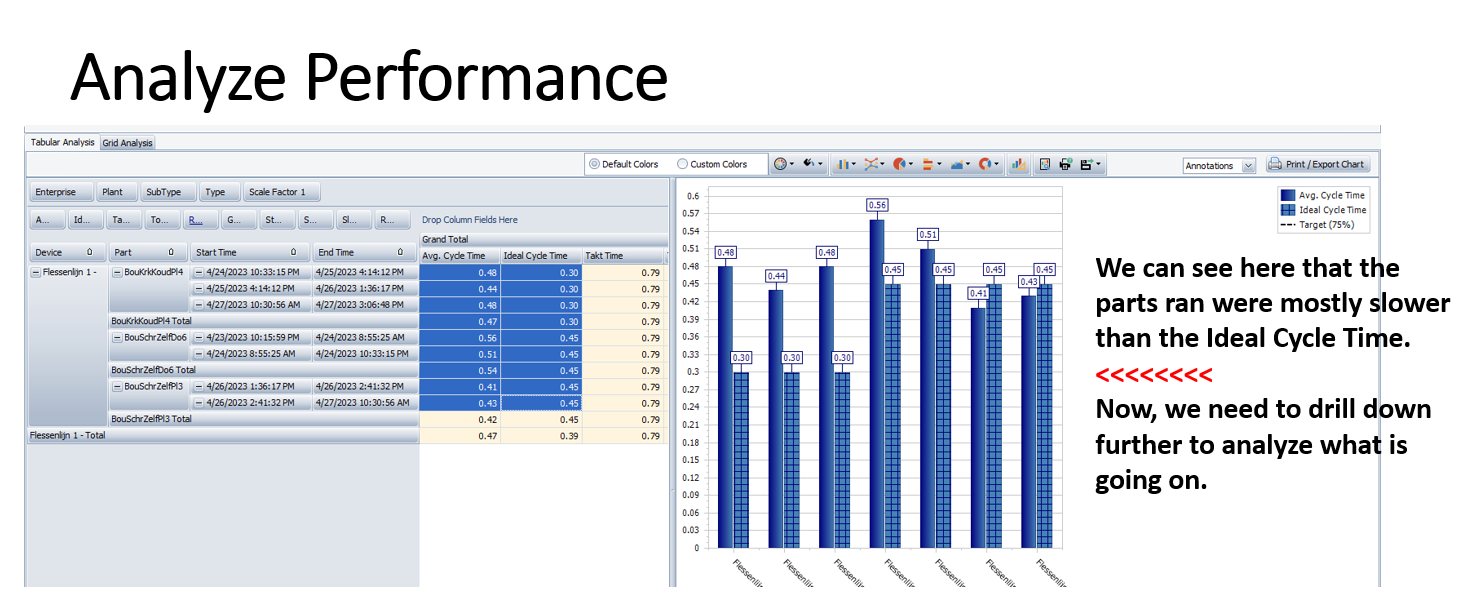
Using Job Data - Job Comparison menu, you can get a better insight as to how your products (parts) are running.