
The complete toolbox for Enterprise Production Reporting
Ad-Hoc Reporting - Shifts & Jobs
Create your own reports and save the layouts for yourself or to share with others.
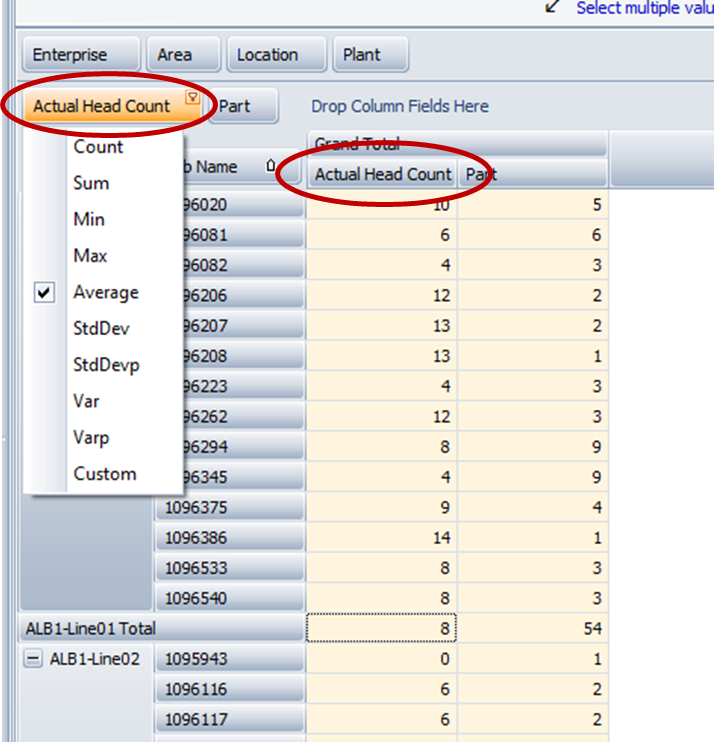
View data in table format or pivot grids where you can interactively change displays
by simply dragging columns to different hierarchies to filter data as needed.
Interactive graphing included.
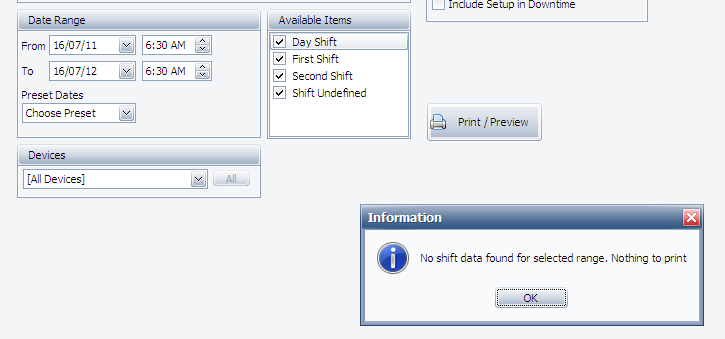
Why won't my Shift report print? Let's take a look at when your shifts end...
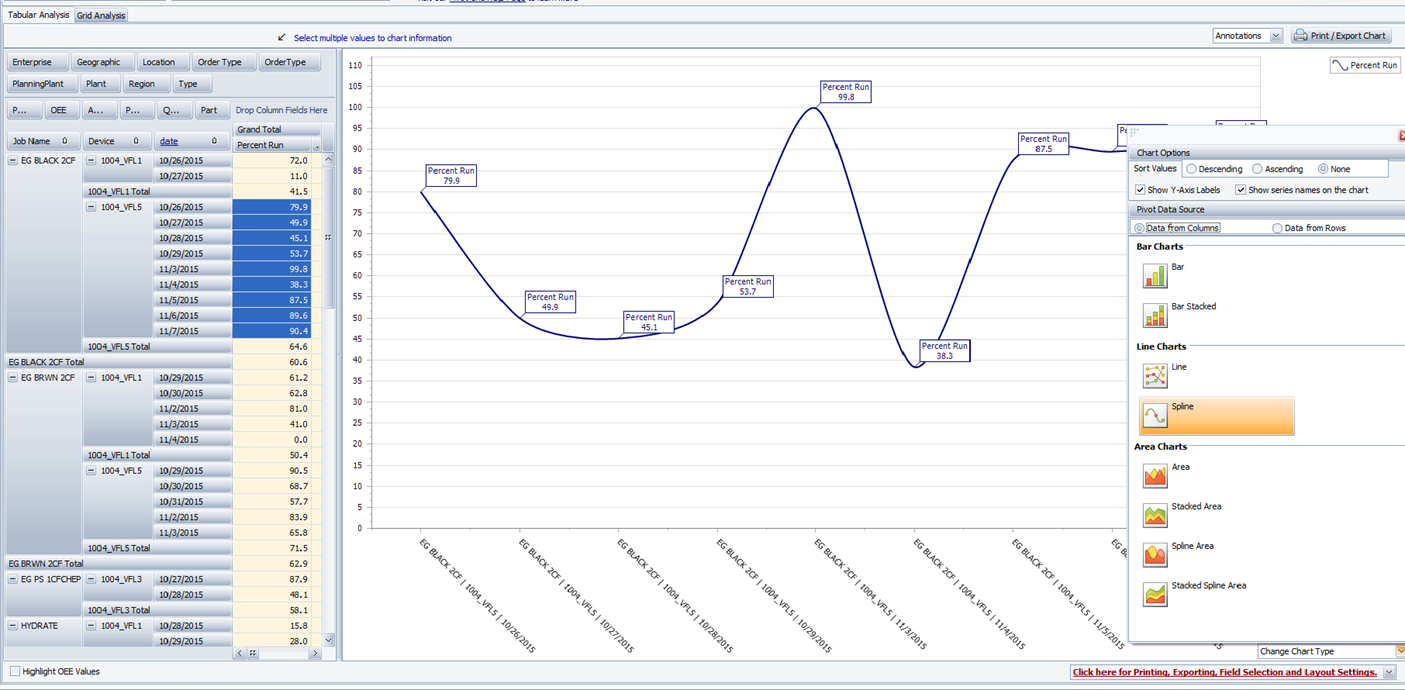
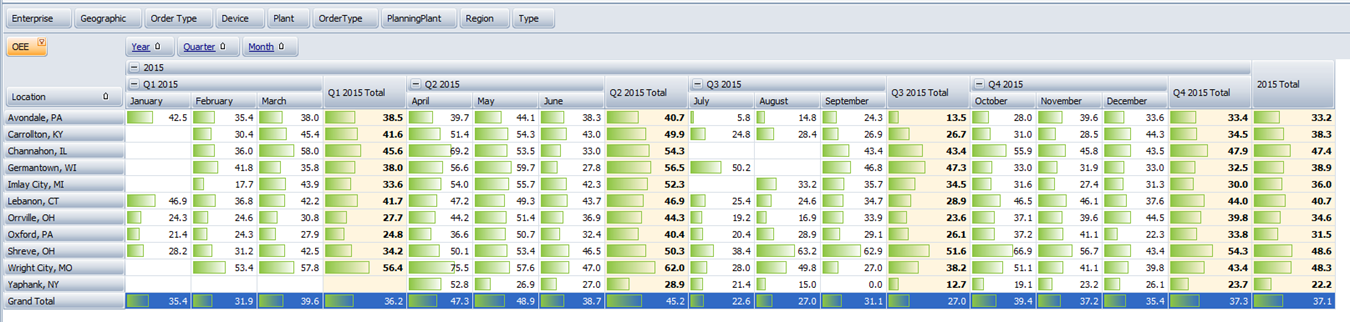
View your data in date hierarchy - Year - Quarter - Month - Week - Day. Then color your chart.
User Numbers and User Strings can contain any type of data. Now you can define your own Field Type for these custom fields.
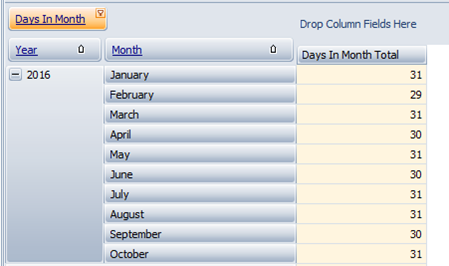
Get Days in Calendar Month Do you need to know how many calendar days are in a month for your special calculation?
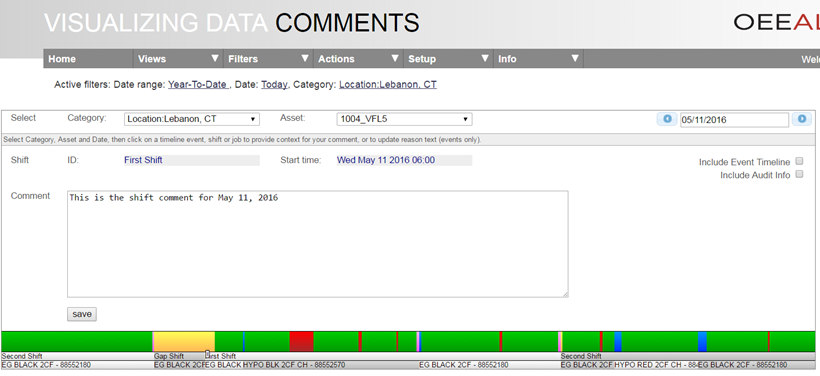
Shift and Job Comments from OEE Alert View the Shift and Job Comments that were entered in OEE Alert.
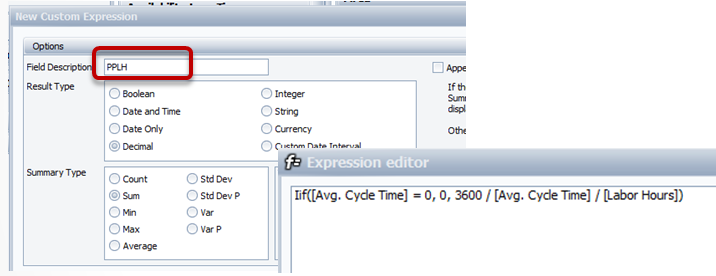
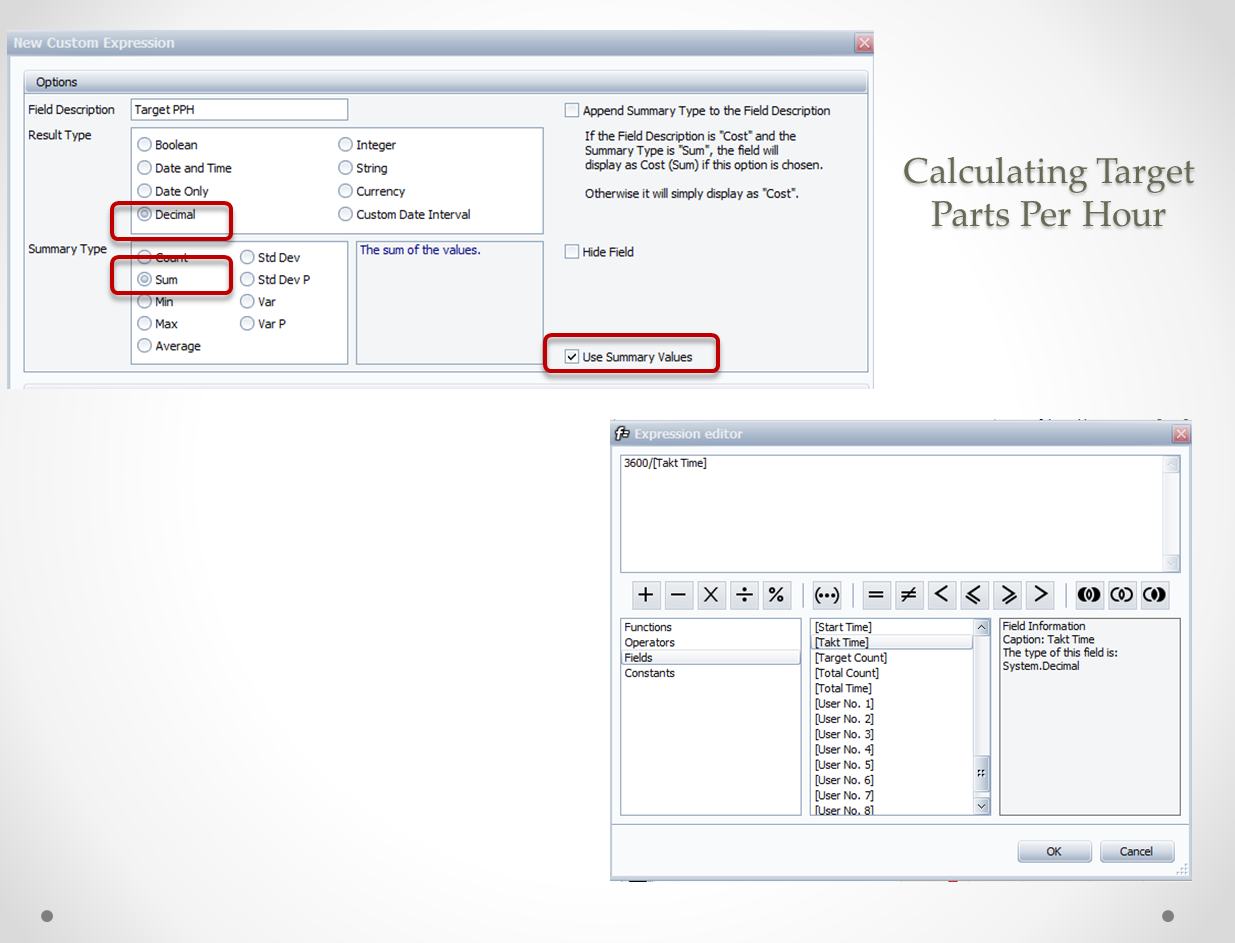
Calculate PPH - PPLH Enter Labor Hours for each Shift and or Job within OEE Alert. This data is then saved with the Shift record and or the Job record. You use this value to calculate Parts Per Labor Hour (PPLH).
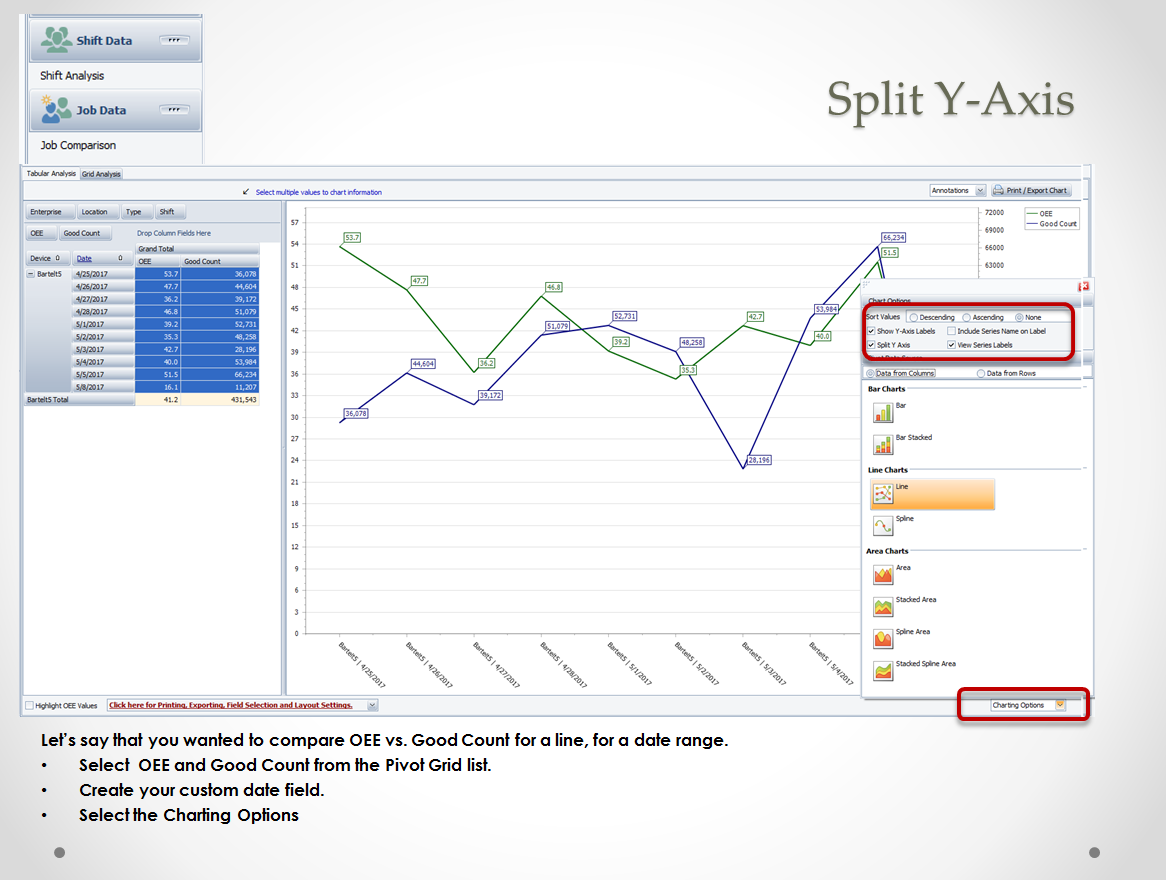
Split Y-Axis Charts Use to compare OEE vs. Good Count for a line, for a date range and chart it!
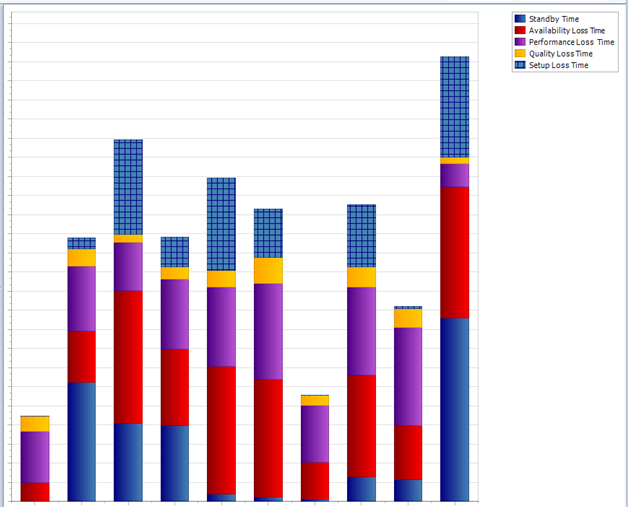
Chart Production Losses The Production Losses or Hidden Factory refers to parts of a manufacturing process that decrease the quality or efficiency of an operation.
